How a structured Google Ads approach activated six European markets in six months
When we took over the Google Ads account in November 2025, Sweden was the main driver of sales. Other markets were active but losing potential — unclear structure, mixed campaign intent and unreliable tracking meant budget was being spent without the control or visibility needed to grow. The opportunity was not to build from scratch. It was to bring structure to what was already there and unlock the markets that were underperforming.

Sweden was the main driver. Other markets were losing potential.
Sweden was converting and demand was real. But across the other markets, budget was being spent without a clear structure — mixed campaign intent, unreliable tracking and no consistent logic for how to allocate spend. The account had the ingredients to grow internationally. What it lacked was the framework to do it predictably.
The first step was not to scale. It was to understand exactly what was working, fix the foundation, and then build outward from there.

Structure first — then market by market activation.
We rebuilt the account foundation before touching budgets: tracking clarity, campaign segmentation by intent (brand, competitor, generic, shopping, remarketing), and feed improvements. Sweden was stabilised as the reference model. The same structural approach was then applied to each remaining market, adapted locally for search behaviour, language, competition and profitability targets.
NOV 2025
Account takeover — Sweden
Tracking rebuilt. Campaigns restructured by intent. Feed optimised. Sweden stabilised as the reference model for all other markets.
NOV – DEC 2025
Netherlands & Norway activated
Existing campaigns restructured using the same framework. Netherlands responded quickly — scaling faster than expected and becoming the leading revenue market.
JAN 2026
Finland & Denmark activated
Structural approach applied with local adjustments for language and search behaviour. Both markets reached profitability quickly.
FEB 2026
Belgium activated
Final market brought to the same standard. Profitable from early on and continuing to accumulate data
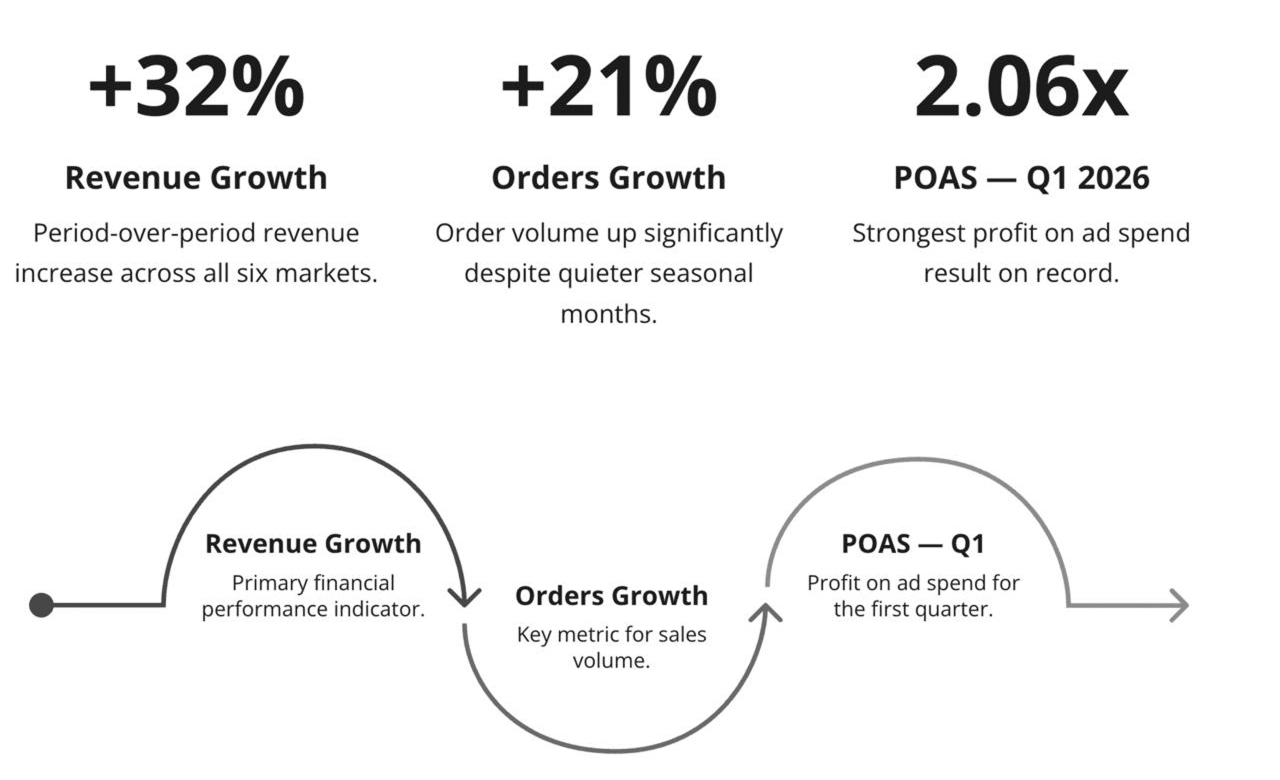
Revenue up 32%. Orders up 21%. Efficiency improving every quarter.
The period Feb–Apr 2026 compared to the previous period (Nov 2025–Jan 2026) shows the impact of the structural changes across all six markets.
Worth noting on this comparison
November and December are by far the peak season for this business. The previous period naturally carried higher revenue volume. Growing 32% on top of that — in what are typically quieter months — makes this result more significant than the number alone suggests.
POAS improving every quarter.
Profit on ad spend from Google Ads grew consistently. The strongest result on record at 2.06x POAS in Q1 2026, with revenue continuing to grow across all six markets.
All six markets profitable.
Every market reached profitability. Netherlands leads on revenue volume, Denmark leads on ROAS efficiency. Belgium, the most recently activated market, is scaling with strong early signals.
5.22x
Netherlands
ROAS · top market
5.70x
Denmark
ROAS
4.92x
Norway
ROAS
4.48x
Belgium
ROAS · scaling
3.48x
Finland
ROAS
3.44x
Sweden
ROAS · reference
Budgets were increased only where performance justified it. Not across all markets at once.
All paid channels healthy. A second main sales engine built alongside a strong one.
Paid social was already working well. The brand was scaling on it — consistent results, strong acquisition, an established channel that did not need fixing. That was the starting point.
The work on Google Ads was not about compensating for something broken. It was about building a second main channel from the ground up — one that captures a different type of demand, operates with its own structure, and adds meaningful revenue on top of what paid social was already generating.
Both channels are now active, contributing and growing. By March 2026, Google Ads had closed most of the gap with paid social in revenue. By April, the two channels were closely aligned — each delivering strong, complementary results across six markets.
The table below shows April 2026 performance across both channels for reference.
Channel | Revenue | ROAS | POAS |
Paid Google | 881,077 kr | 4.21x | 2.18x |
Paid social | 802,291 kr | 2.43x | 1.30x |
Data source: Reaktion. Period: 1 April – 30 April 2026. All monetary values in SEK incl. VAT.
The markets were already there. Structure is what made them perform.
The biggest change over six months was not launching new countries. It was applying a consistent, replicable structure to markets that were already in the account but not properly set up. Tracking, segmentation, feed quality and budget logic — applied consistently across six countries — is what drove the growth.
This approach works best for businesses that already have market presence but feel Google Ads is not delivering what it should. The constraint is rarely budget. It is usually structure and decision clarity.
More Case Studies


How We Helped Scanfarma Achieve +200% Growth in 14 Months
- +200% revenue growth in 14 months
- Boosted revenue by 235% with Google Ads

How Becker.dk Stopped Treating 800,000 Products Equally — and Turned Google Ads into a Profit Engine
- Scaled Google Ads revenue from €100K to €400K+/month
- Increased ROAS from 6.0 to 9.35 (+56%)


How Accent Clothing Recovered Up to 51% of Misallocated Google Ads Spend and Increased ROAS from 1.95 to 8.37 in 5 Months
- Recovered up to 51% of misallocated ad spend
- Increased ROAS from 1.95 to 8.37 in 5 months